Introduction
In the apparel industry, quality control is paramount to ensure that products meet both customer expectations and regulatory standards. The Accepted Quality Level (AQL) chart is a crucial tool used by manufacturers and inspectors to determine the maximum number of defective items allowed in a sample size without rejecting the entire batch. This blog will explore what AQL is, how Accepted Quality is used in the apparel industry, and its significance in maintaining product quality.
What is Accepted Quality Level (AQL)?
Accepted Quality Level (AQL) is a statistical measurement used in quality control to define the maximum number of acceptable defects in a batch of products. It represents a compromise between product quality and the cost of inspection. AQL values are expressed as percentages, with lower values indicating stricter quality standards.
For example, an Accepted Quality (AQL) of 1.5 means that out of 100 items, no more than 1.5 items (rounded up to 2) can be defective. If the number of defects exceeds this threshold, the entire batch is rejected or subjected to further inspection.
How is AQL Determined?
AQL levels are determined based on the specific quality requirements of the product and the acceptable risk of defects. These levels are usually categorized as follows:
- Critical Defects (AQL 0.1 – 0.5): Defects that could cause harm to the user or render the product unusable.
- Major Defects (AQL 1.0 – 2.5): Defects that affect the functionality or appearance of the product but do not pose a safety risk.
- Minor Defects (AQL 4.0 – 6.5): Defects that do not significantly impact the product’s performance or appearance but may affect customer satisfaction.

The AQL chart considers three key factors:
- Sample Size: This refers to the number of garments randomly selected from a batch for inspection.
- AQL Level: This is the predetermined maximum percentage of defective items allowed in the sample. Common AQL levels in apparel include 2.5%, 4.0%, and 6.5%.
- Acceptance/Rejection Criteria: Based on the sample size and the number of defects found, the chart indicates whether the entire batch is acceptable or needs to be rejected or re-inspected.
AQL Process
The AQL process, also known as Acceptance Quality Limit sampling, is a statistical method used in the apparel industry (and many others) to ensure that a shipment of products meets pre-defined quality standards. Here’s a breakdown of the key steps involved:
1. Define Quality Levels and AQL:
- Define Defects: Clearly establish what constitutes a defect for your product. This could include anything from stitching imperfections to material flaws or functional issues.
- Set AQL Levels: Determine the acceptable percentage of defective items allowed in a random sample. Common AQL levels in apparel are 2.5%, 4.0%, and 6.5%. A lower AQL signifies stricter quality standards.
2. Select a Sampling Plan:
There are different sampling plans associated with AQL charts, each with its own procedure for determining sample size and decision-making:
- Single Sampling: The simplest plan. A random sample is drawn, and the batch is accepted or rejected based on the number of defects found compared to the acceptance/rejection criteria in the AQL chart for that sample size and AQL level.
- Double Sampling: A more complex plan involving two sample draws. If the first sample falls within an “inconclusive zone,” a second sample is drawn. The combined results from both samples determine the acceptance or rejection of the batch.
- Multiple Sampling: An even more intricate plan involving multiple sample draws with increasing sample sizes. This is typically used for very large batches or when stricter control is needed.
3. Conduct the Inspection:
- Random Sampling: Randomly select the specified number of garments from the entire batch for inspection.
- Defect Inspection: Inspect each garment in the sample thoroughly, following the pre-defined criteria for identifying defects.
- Record Keeping: Document the number and type of defects found in each garment.
4. Evaluate Results using the AQL Chart:
- Compare Results: Locate the sample size and AQL level used on the AQL chart.
- Acceptance or Rejection: Based on the number of defects found in the sample, consult the acceptance/rejection criteria on the chart for that specific sample size and AQL level. The chart will indicate whether the entire batch is considered acceptable or needs to be rejected or re-inspected.
5. Take Action:
- Acceptable Batch: If the batch is deemed acceptable, it can proceed to shipment or further processing.
- Rejected Batch: If the batch is rejected due to exceeding the AQL limit, corrective actions need to be taken. This might involve re-inspecting the batch, re-working defective items, or potentially rejecting the entire shipment.
Benefits of the AQL Process:
- Standardized Quality Control: Provides a consistent and objective way to assess product quality.
- Reduced Risk of Defects: Early identification of defective items minimizes the chances of faulty products reaching customers.
- Improved Communication: Establishes a clear understanding of quality expectations between buyers, manufacturers, and inspectors.
- Cost-Effective: Focuses inspection efforts on random samples, reducing the need for 100% inspection.
Using the AQL Chart in the Apparel Industry
In the apparel industry, AQL charts are used during the inspection process to ensure that garments meet the desired quality standards. Here’s how the AQL process works:
- Define Inspection Levels: Decide on the AQL levels for critical, major, and minor defects based on the product’s quality requirements and customer expectations.
- Select Sample Size: Determine the sample size using the AQL chart. The sample size is based on the total lot size (the number of items in the batch) and the desired inspection level (e.g., normal, tightened, or reduced inspection).
- Inspect the Sample: Inspect the selected sample for defects, categorizing them as critical, major, or minor.
- Compare with AQL: Compare the number of defects found in the sample with the acceptable limits defined by the AQL chart. If the defects are within the acceptable range, the batch is accepted. If not, the batch is rejected or subjected to further inspection.
Example of an AQL Chart
Here is an example of an AQL chart commonly used in the apparel industry:
| Lot Size | Sample Size | AQL 1.5 (Major) | AQL 4.0 (Minor) |
| 1 – 25 | 5 | 0 | 0 |
| 26 – 50 | 8 | 0 | 1 |
| 51 – 90 | 13 | 1 | 1 |
| 91 – 150 | 20 | 1 | 2 |
| 151 – 280 | 32 | 2 | 3 |
| 281 – 500 | 50 | 3 | 5 |
| 501 – 1200 | 80 | 5 | 7 |
| 1201 – 3200 | 125 | 7 | 10 |
| 3201 – 10000 | 200 | 10 | 14 |
| 10001 – 35000 | 315 | 14 | 21 |
| 35001 – 150000 | 500 | 21 | 21 |
| 150001 – 500000 | 800 | 21 | 21 |
Importance of AQL in the Apparel Industry
1. Consistency in Quality
By adhering to AQL standards, manufacturers can ensure a consistent level of quality across different production batches. This consistency helps in building and maintaining brand reputation.
2. Customer Satisfaction
High-quality products lead to higher customer satisfaction and loyalty. By minimizing defects through AQL inspections, apparel companies can meet customer expectations more reliably.
3. Cost Efficiency
While quality inspections involve costs, AQL helps strike a balance between the cost of inspection and the risk of defects. This balance ensures that resources are used efficiently without compromising on product quality.
4. Regulatory Compliance
Many regions have stringent regulations regarding product quality, especially in sectors like children’s clothing and safety apparel. AQL helps manufacturers comply with these regulations by maintaining high-quality standards.
AQL Chart for the Apparel Industry: Understanding the Basics
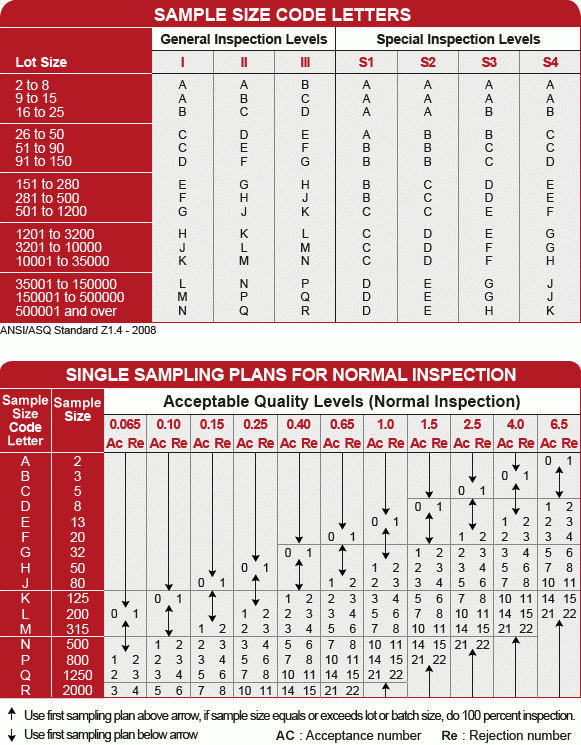
The Accepted Quality Level (AQL) chart is a cornerstone of quality control in the apparel industry. It helps manufacturers, buyers, and inspectors ensure garments meet pre-determined quality standards. While the specific chart format might vary depending on the source, here’s a breakdown of the key elements:
Components of an AQL Chart:
- Sample Size: This is listed horizontally across the top row of the chart. It represents the number of garments randomly selected from a larger batch for inspection. Sample sizes can vary depending on the lot size (total number of garments) being inspected.
- AQL Levels: These are displayed vertically in the first column of the chart. They represent the maximum acceptable percentage of defective items allowed in the sample. Common AQL levels in apparel include 2.5%, 4.0%, and 6.5%.
- A lower AQL level indicates a stricter quality standard, allowing for fewer defects in the sample.
- A higher AQL level allows for a slightly higher number of defects.
- Acceptance & Rejection Numbers: These are found within the body of the chart. They represent the maximum number of defects allowed for a specific sample size and AQL level for the batch to be considered acceptable.
How to Read an AQL Chart:
Imagine you have a batch of 1,200 t-shirts and you’ve agreed upon an AQL level of 4.0% with your manufacturer. Let’s say the AQL chart you’re using indicates a sample size of 80 garments for a lot size of 1,200.
- You would randomly select 80 t-shirts from the batch for inspection.
- Find the row corresponding to a sample size of 80 in the chart.
- Locate the column corresponding to the AQL level of 4.0%.
- The number at the intersection of this row and column represents the maximum number of defects allowed in the sample for the batch to be considered acceptable.
For example, if the AQL chart shows an “Acceptance Number” of 5 at this point, it means:
- If you find 5 or fewer defects in your sample of 80 t-shirts, the entire batch of 1,200 garments is considered acceptable.
- However, if you find 6 or more defects in the sample, the batch would be considered unacceptable and might require further inspection or re-work.
Important Considerations:
- Choosing the Right AQL Level: The appropriate AQL level depends on the severity of the defect and the garment’s price point. Critical defects (e.g., faulty zippers) might have a lower AQL, while minor flaws (e.g., uneven stitching) might have a higher AQL.
- Sampling Plans: AQL charts often come with different sampling plans (single, double, or multiple sampling). The chosen plan determines the number of samples drawn and the decision-making process based on the number of defects found.
Benefits of Using AQL Charts:
- Standardized Quality Control: AQL charts provide a clear, objective way to assess garment quality, ensuring consistency across production runs.
- Reduced Risk of Defects: By identifying defective items early, AQL charts help prevent them from reaching customers, protecting your brand reputation.
- Improved Communication: AQL charts create a common language for manufacturers, buyers, and quality inspectors, facilitating clear communication regarding quality expectations.
Understanding the AQL Chart:
While the specific format of AQL charts may vary, they generally include:
- Sample Size: Listed horizontally across the top row.
- AQL Levels: Displayed vertically in the first column.
- Acceptance & Rejection Numbers: Represented within the body of the chart. These numbers indicate the maximum number of defects allowed for a sample size and AQL level to be considered acceptable.
Important Considerations:
- Choosing the Right AQL Level: The appropriate AQL level depends on the severity of the defect and the garment’s price point. More critical defects might have a lower AQL (e.g., 2.5%), while minor flaws might have a higher AQL (e.g., 6.5%).
- Sampling Plans: AQL charts often come with different sampling plans (single, double, or multiple sampling). The chosen plan determines the number of samples drawn and the decision-making process based on the number of defects found.
Takeaway
The Accepted Quality Level (AQL) chart is a vital tool in the apparel industry, ensuring that products meet predefined quality standards before reaching customers. By defining acceptable levels of defects and providing a systematic approach to quality inspection, Accepted Quality (AQL) helps manufacturers maintain consistency, enhance customer satisfaction, and comply with regulatory requirements. Understanding and effectively using AQL charts can significantly contribute to the success and reputation of apparel businesses in today’s competitive market.